July 28, 2014
Spectral power distribution (SPD)
A spectral power distribution (SPD) is a graph of the energy levels of a light source through a range of wavelengths of light. The spectral power distribution is the true “fingerprint” of a light source, as it is the key to how the light source renders colors.
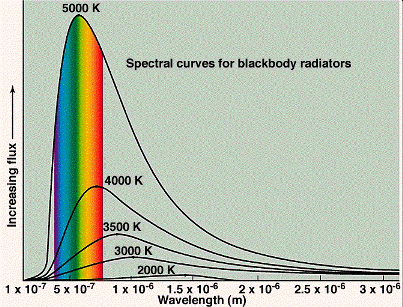
The image below shows the SPD of an ideal (blackbody) light radiator. The colored range represents its energy levels in the visible light spectrum.
Light source engineers and manufacturers aim to create optimal lighting solutions for viewing colors within an accepted color temperature range. The accepted universal standard for color viewing in graphic arts and photography is 5000K, which is meant to approximate daylight. This is more commonly referred to as D50. The closer a light source’s spectral power distribution is to D50, the more consistent and accurate it is. While D50 is considered ideal, the actual energy levels measured in a light source are varied throughout the visible spectrum of light and are not always as accurate as exactly D50. Therefore, light sources are tested for the energy they give off at each wavelength of the visible spectrum. These values are compiled and presented in the SPD of that light source. The top image shows the spectral power distribution of GTI’s Graphiclite® light sources, graphed in reference to the D50 curve, in order to show their high level of accuracy for color viewing.